The addition of GPS units to every Tour rider’s bike this year has meant plenty of information for analysts at Dimension Data to wade through – four to six million records per stage in fact.
The company’s efforts have resulted in some interesting facts and figures about the world’s most prestigious bike race. Here are the highlights.
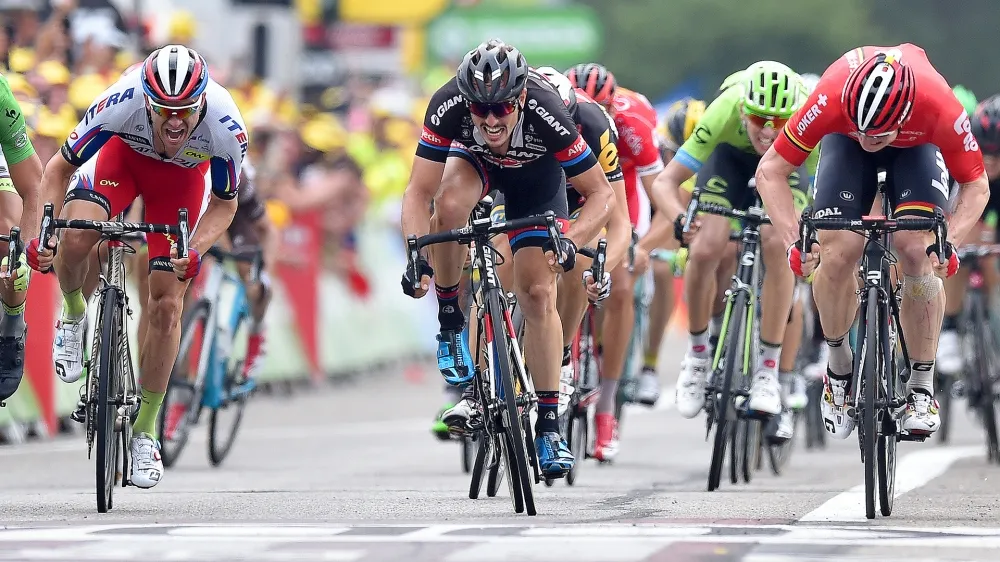
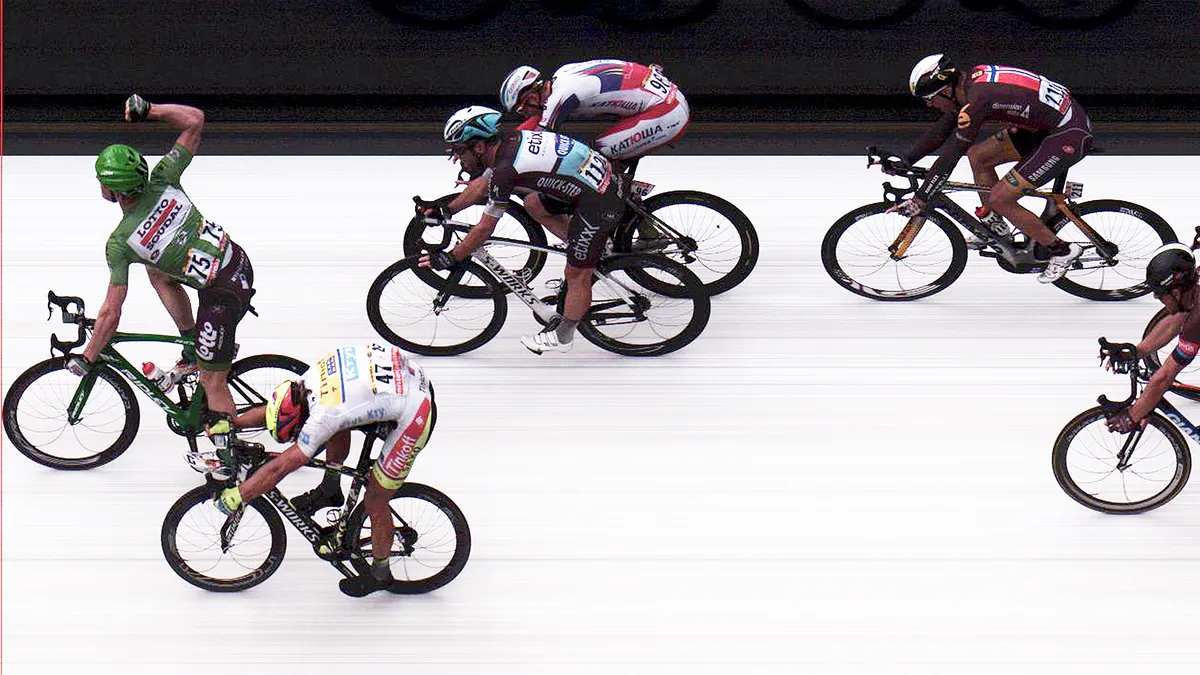
The five highest recorded sprint speeds were:
- 78.48 km/h (48.77 mph) – John Degenkolb (Stage 5)
- 76.46 km/h (47.51 mph) – André Greipel (Stage 8)
- 75.13 km/h (46.68 mph) – Peter Sagan (Stage 7)
- 64.67 km/h (40.18 mph) – John Degenkolb (Stage 10)
- 62.96 km/h (39.12 mph) – Thomas De Gendt (Stage 18)
The average recorded speed of the riders across all 21 stages of the 2015 Tour was 38.34 km/h (23.82 mph), with the average stage distance being 160km.
The highest average speed for a single stage was 55.45km/h (34.46 mph) on Stage 1’s time trial in Utrecht.
The riders’ lowest average recorded speed across the 21 stages was 28.94 km/h (17.98 mph) on Stage 19, which saw the peloton take on the category one Col du Chaussy, haute category Col de la Croix de Fer, second category Col du Mollard and finish the day on the ascent of the first category Le Corbier.
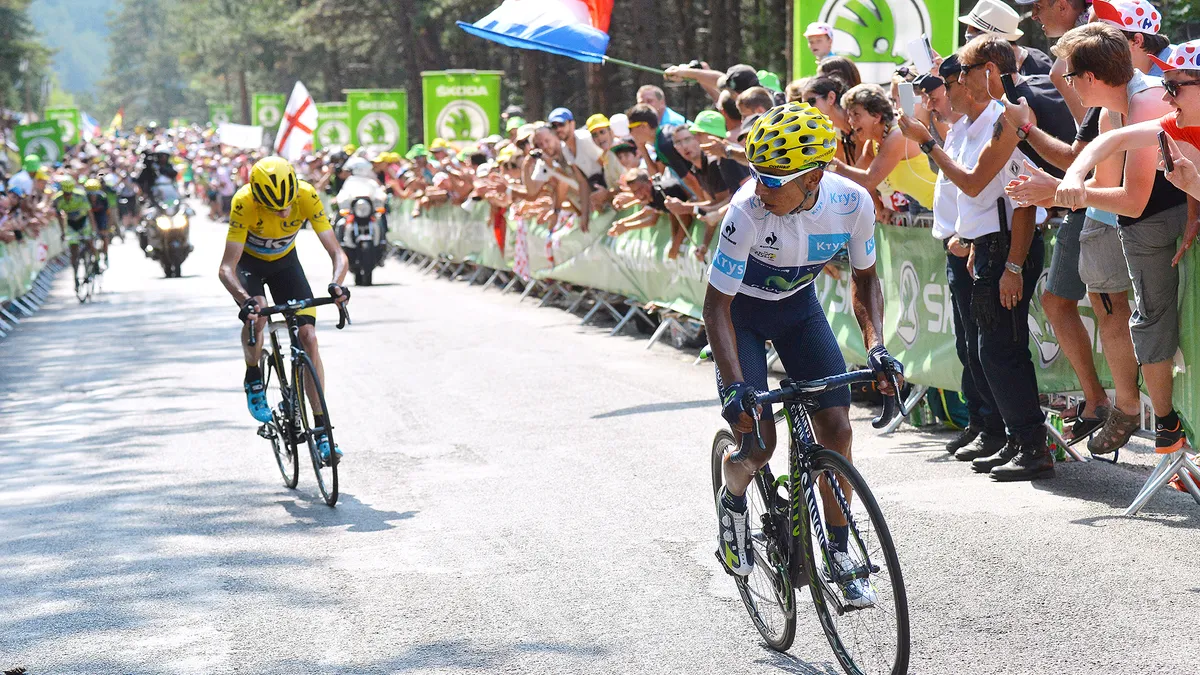
Being a tough Tour fought in the mountains, the 58 categorised climbs meant total climbing of 59,556m (195,394 ft) – about 6.7 times the height of Mount Everest.
The five climbs with the lowest recorded average speed were:
- 15.52 km/h (9.64 mph) – Côte de la Croix Neuve, Stage 14 (3km Cat 2 at 10.3%)
- 15.84 km/h (9.84 mph) – Alpe d’Huez, Stage 20 (13.8 km HC at 8.1%)
- 16.21 km/h (10.07 mph) – La Pierre-Saint-Martin, Stage 10 (15.3 km HC at 7.4%)
- 16.49 km/h (10.25 mph) – Plateau de Beille, Stage 12 (15.8 km HC at 7.9%)
- 16.76 km/h (10.41 mph) – Lacets de Montvernier, Stage 18 (3.4 km cat. 2 at 8.2%)
Finally, Dimension Data calculated that the riders burned an estimated 23,940,000 calories, equivalent to about 85,807 hamburgers.
If you want to find out more stats, you can download Dimension Data's full report.
The addition of GPS units on every bike might not have led to a marked increase in data for broadcasters during each stage, but the wealth of information hints at greater integration of data in the future, with over 660,000 visits to the Beta live tracking website over the three weeks.
Stay up to date with the latest Tour tech at our Tour de France 2015 homepage.