Where’s the best place to ride in the UK and which roads are riders being short-changed on when it comes to maintenance? Where are cyclists most likely to get the best prices for a new bike and which places are they most likely to have their bikes stolen?
Wondering what the best cities are worldwide for cycling? Look no further than this detailed round-up of 90 global cities.
For a true picture of the state of cycling in Britain today, we've adopted the statistician’s cap and leafed our way through mountains of official cycling statistics pedalling their way around the UK to determine the current state of cycling in Britain's cities.
The 2015 Sport England Active People Survey reveals that 2,069,200 adults in England alone now ride regularly. Throughout the whole of Great Britain, the latest National Travel Survey shows about 8 percent of the population cycle three or more times a week — that’s 5.1-million people in all. The number of miles cycled altogether (3.25 billion) has risen 3.8 percent in the past year (more than either by motorcycle or bus). And according to Mintel, 31 percent of women are now saying that they are cyclists — up from 26 percent in 2014.
Throughout Britain 3.63-million cycles were sold last year, around 8 percent more than the year before, and 98.6 percent of them are imported. On the downside, those local authorities charged with making roads safer and cities more accessible have been hit with budget cuts and policy shifts that could set back much of the good work. The Department for Transport’s own data shows that 61 percent of Brits still believe that it is too dangerous for them to cycle on the roads. So, onto more stats…
1. Popularity
Most popular UK city for cycling
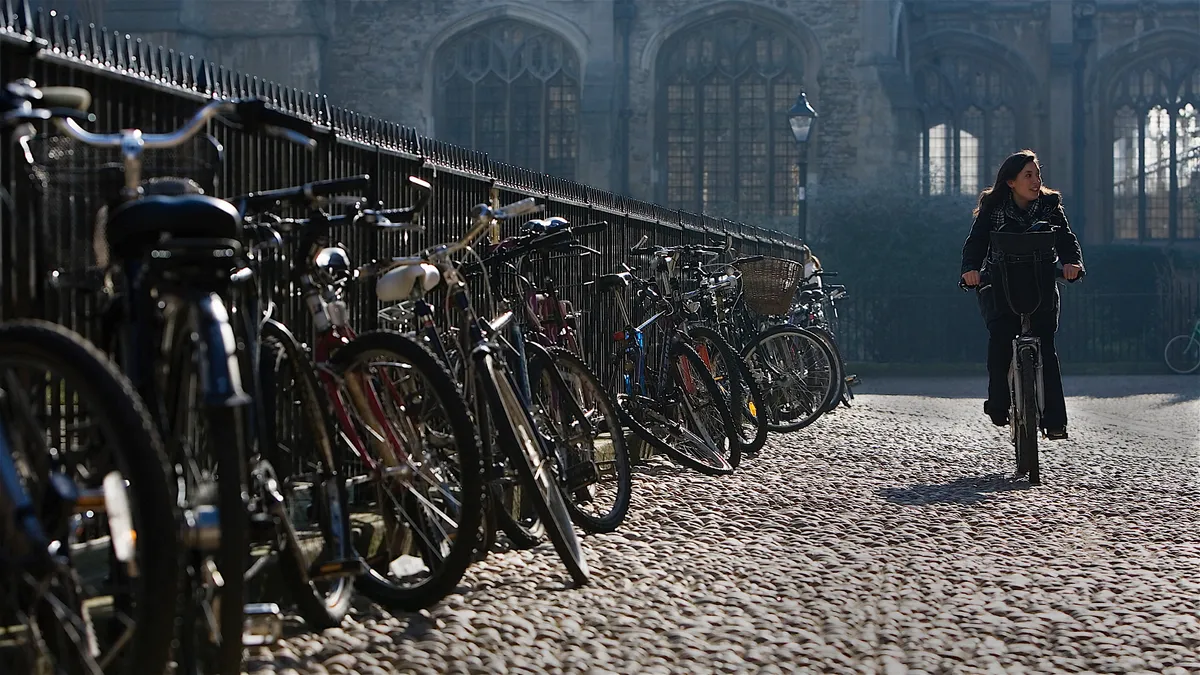
Topping the list is Cambridge, whose residents (33%) cycle at least three times a week with almost half the adults riding at least once a week. So what does Cambridge do so well?
The most car-dependent English towns and cities include the ones that expanded most rapidly in the 1960s and 1970s – Colchester, Milton Keynes and Peterborough
Admittedly it’s one of our nation’s flattest urban areas, but it also features over 80 miles of dedicated cycle lanes and routes. Its pro-cycling culture is also nurtured via a series of schemes including: restrictions on car-parking permits, so a third of the city’s population have the option of two wheels or no wheels; road priority given to cyclists in key busy spots, leading to a 15 percent drop in motor traffic; and business incentives to establish bike hire and parking facilities in the city.
Oxford comes second with 22 percent of locals riding three or more times a week, then York with 16 percent while Exeter, Norwich and Manchester also do well.
A separate Cycle Scotland report shows that Edinburgh leads the way with 12 percent of citizens commuting by bike regularly. Beyond the capital, the regions of Moray (10.3%), Argyll & Bute (9.1%) and Stirling (8.7%) are all excelling.
Least popular city for cycling
The same Scottish survey found that while the volume of bike traffic has increased by almost a third since 2003, cycling as a main mode of travel in Scotland overall is estimated at just 1%; in its worst city, Aberdeen, it stands at a rather meagre 0.3%.
The most car-dependent English towns and cities include the ones that expanded most rapidly in the 1960s and 1970s – Colchester, Milton Keynes and Peterborough – which sit at the foot of the table in the Campaign for Better Transport’s 2014 Car Dependency Scorecard, the last of which, Peterborough, has its recent history as a ‘new town’ to blame for its poor showing. Its own council officials concede it was “built at a time when the car was seen as the most desirable mode of transport”.
Indeed, 70-year-old Dave Stanbridge, who’s been a member of Peterborough CC since 1965 and still rides three times a week, was scathing of the Cambridgeshire city. “Take the Green Wheel Cycleway,” he says. “It’s designed to help cyclists circumnavigate their way round the City, which is a great idea on paper but clearly not designed by cyclists. The majority of its surfacing makes it unsuitable for road bikes. The other cycle paths are no better. You ride over them as a bass singer but come off them as a high alto!”
2. Pollution
Most polluted city
It’s a choker for Nottingham to be dubbed the UK’s dirtiest city for cyclists, but when the World Health Organisation (WHO) picks you out for bad breath conditions then something literally is in the air. Nottingham’s concentration of Particulate Matter (PM) scored highest among the cities tested when the WHO toured the nation measuring where PMs exceeded the safe annual average level of 20ug/m3.
The city found itself alongside Essex’s factory-strewn container port Thurrock with levels of bitty air pollution that scored 25ug/m3. Birmingham, Leeds, London and, rather surprisingly, Southampton (21ug/m3) were also in the WHO bad books. While Southampton’s local emissions aren’t high, they’re affected by airflow from the near continent, said researchers from the University of Leeds.
Nottingham insists, however, that the WHO findings should be updated as a series of infrastructure changes have made the city cleaner of late. In October 2015, for instance, work began on the city’s first ‘cycle super highway’, part of a planned network of 25km of cycle paths, dedicated lanes and off-road routes to be completed by March 2017.
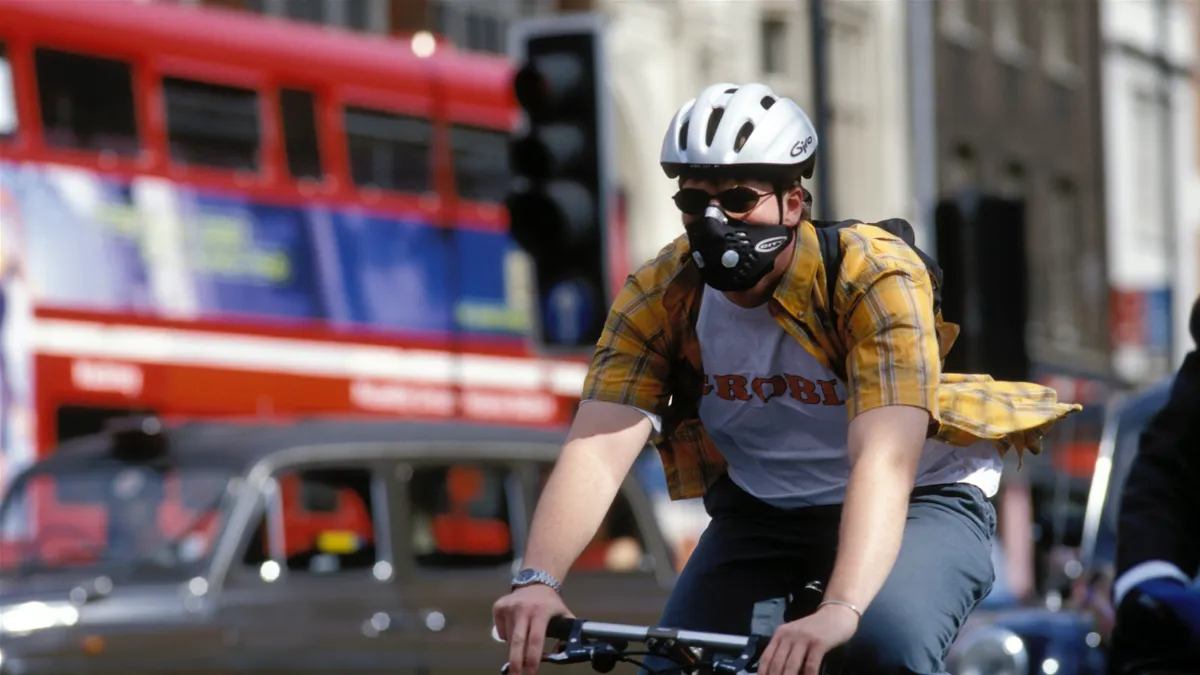
Darren Cole, Nottingham cat 2 racing cyclist, agrees that things are improving. “I’ve seen the report on the pollution levels but I’ve never worn a mask,” he says. “To be honest, it’s never affected me and I ride around 250 miles a week. I’d still say it’s more beneficial health wise on bike than sat in a car breathing in diesel.”
For cyclists choking on their ‘Boris bikes’ in the capital city — second on the WHO list of sick cities due in no small part to the rise in popularity of diesel engines in domestic cars — initiatives including pollution-catching plants and central London congestion charging are failing to have an impact.
3. Facilities
Best for services
The 2016 data from the Association of Cycle Traders, who represent over 4,000 cycle businesses from retail outlets to mobile repair and permanent workshops as well as hire centres, reveals where the love of all things bike-related is greatest: Bristol. With 61 venues on the association’s Britain-wide list, a total population of 438,000 leaves it second only to inner London (3.2 million). Cambridge 32, Glasgow 28 and Sheffield and Edinburgh (both 27) are the next highest cities when it comes to catering for cyclists’ needs.
Greater and central London, with well over 300 shops, rent-a-bike stores and fix-it venues listed with the Association, dominates the latest listings — but on the regional front Lancashire, Devon, Hampshire, Kent, Surrey and North Yorkshire all have over 100 facilities registered. Special mention also goes to Essex (90 venues), Hertfordshire (79), the West Midlands (78), and the Highlands and islands of Scotland (86).
4. Roads

Best for pothole repairs
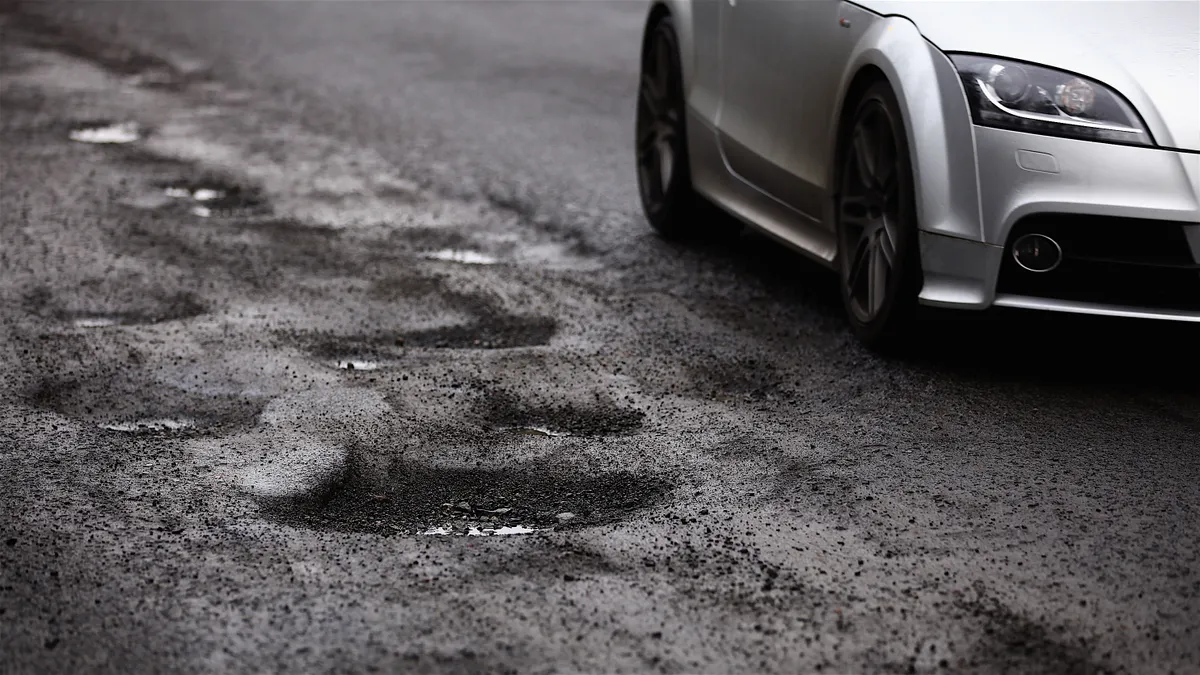
While road accident rates among other users — cars, pedestrians and motorcyclists — are falling, increasing numbers of cyclists are being killed on British highways. The 2015 RoSPA figures show that over 34,000 cyclists were killed or injured in the previous 12 months. Included in the causes are ‘poor road maintenance’ as local authorities fail to fix potentially fatal potholes. The deep-road divots are also a key contributor to the £23.8-million in compensation paid by councils to road users annually according to the Asphalt Industry Alliance.
In 2014, a record 183,423 employees participated in the Government’s ‘Cycle to Work Scheme’
The Cycling Tourist Club (CTC) continue to pester the powers that be to repair roads and save the lives of cyclists. Since their ‘Fill that Hole’ website was launched in 2007, there have been over 91,000 pothole reports submitted by cyclists and other road users.
The most up-to-date figures reveal that riders in the North East of England are least likely to come a cropper on the road as their local authorities are on the ball when it comes to the pitfalls that are potholes.
The cities of Sunderland and Newcastle top the league, and Northumberland’s regional authority can take the plaudits for repairing the entire total of potholes (1,016) reported to them in a calendar year. The tarmac-replacing Maccams in Sunderland, along with those in Durham, North and South Tyneside, Gateshead and Middlesbrough and Redcar, all proved near perfect when it came to potholes, too.
Only those repairing the roads around London’s borough of Islington break into a top baker’s dozen that’s dominated by teams – of potholes repairmen – from the North East. “The tables show which authorities are best at fixing their road defects,” explains David Murray, spokesperson for the website.
And the worst? Well, Scotland in general, and Transport Scotland, West Dunbartonshire, Dumfries and Galloway in particular. Lowest of all when it came to responding to repair report requests is the regional authority for Blaenau Gwent in Wales.
In terms of specific cities, Plymouth — which has been cited by Streetrepairs.co.uk as one of the worst for pothole repair in England — Manchester and Edinburgh have all been named and shamed in road-condition reports since 2010. In one survey, seven out of the top-10 worst roads for potholes were north of the border.
5. Infrastructure
Cities making the greatest improvements
- Leicester…The walkers of Leicester are increasingly turning to pedal power in a way that’s not only improving the quality of life in the east Midlands city but is also proving to be an inspiration for others. The implementation of a cycle-biased street planning initiative, Connecting Leicester, has seen cycling overtake driving and taking the bus as the main vehicle for visitors travelling to the shops in the city.
- Leeds… On the back of hosting the inaugural stage of the Tour de France in 2014, Leeds has become one of the UK’s leading cycling success stories with the highest growth in the number of cyclists in any city following the race — a 15 percent increase in bike users in and around the city.
- Liverpool… Following the city’s successful Bike2Work scheme, Liverpool’s council has pledged a substantial investment in the creation of a network of safe cycle routes and safety improvements as part of a ‘Cycling Revolution’ strategy aiming to increase the numbers of people cycling regularly by 2017 from 15,000 to 45,000.
6. Safety
Where do city-centre cyclists feel in most danger?
While the long route out of town may make Manchester a popular starting point for sportives, the city-centre traffic has local riders cursing the term ‘Madchester’. In a 2015 survey of 11,000 road users, cyclists are more fearful of riding on the roads in Manchester than any other city. While Cardiff (67%), Newcastle (66%) and Bristol (61%) came out tops in the study of ‘Safest Cities For Cycling’, almost half of the cyclists interviewed in the city claimed the streets weren’t safe enough for them to enjoy commuting or training on during the day.
In addition, only 20 percent of Manchester cyclists feel safe about riding on the city’s streets at night. It makes disappointing reader for a city that’s home to the National Cycling Velodrome.
7. Commuting
Best city for seeing a significant rise in commuting cyclists
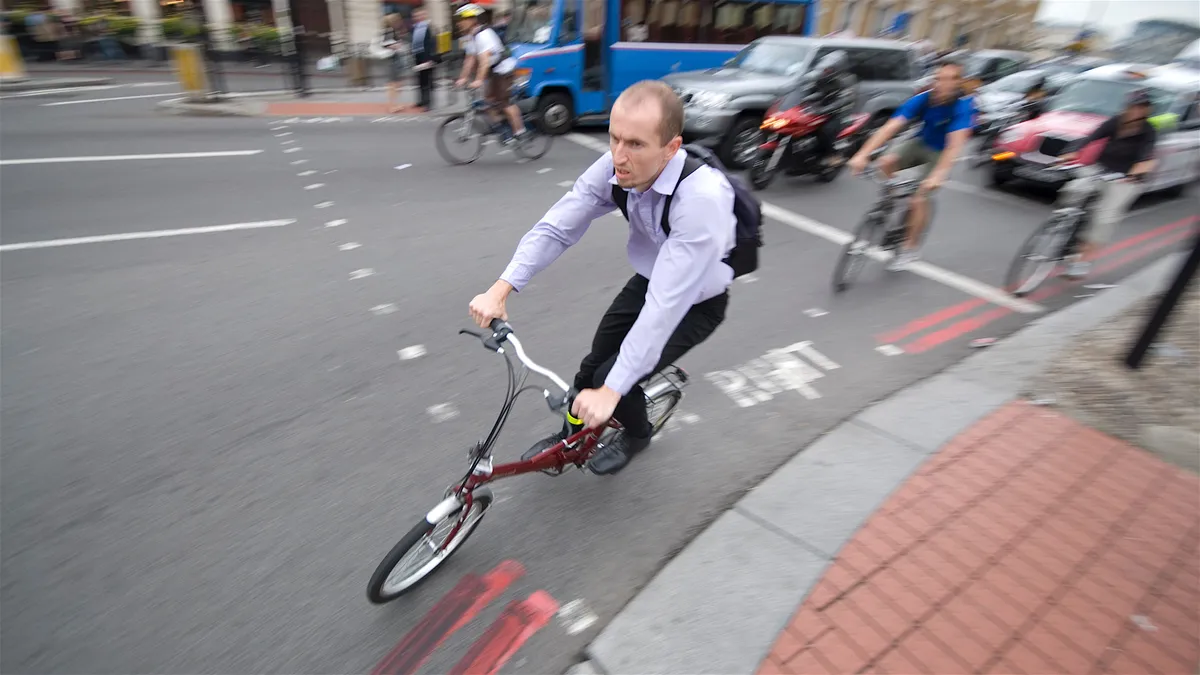
There’s little doubting that the nation’s workers are taking to two-wheels more and more these days, hopefully triggering a rise in the number of bike spaces allocated on Network Rail Trains! And probably ensuring the production line at Brompton Bikes has been a busy place of late.
In 2014, a record 183,423 employees participated in the Government’s ‘Cycle to Work Scheme’ — an 11.6 percent increase in take-up on the previous 12 months. Brighton, Bristol, Manchester, Newcastle and Sheffield have seen substantial increases over the past 15 years. Cambridge too deserves a mention in dispatches — 29% of its working residents cycle-commute, a higher rate than any other local authority (next down is Oxford at 17%).
Of course, it’s not all wonderful news. In its October 2015 survey of 13,148 employees participating in a Cycle to Work Scheme, the Cycle to Work Alliance found that while the initiatives set up to encourage commuters to go by bike whenever possible are on the rise, there are still some cities, including Glasgow, where take-up is poor among potential riders.
8. Security
Worst city for finding just a busted bike lock left on the railings
According to the Office for National Statistics, 381,000 bikes were stolen in England and Wales alone in the 12 months leading up to March 2015. In the available data for Scotland, reported cycle theft in Edinburgh makes it the third worst city in the United Kingdom for returning to an empty space where once a gleaming Cinelli stood.
In Northern Ireland, bike theft has been described as being at a ‘virtual epidemic’ stage — up 80 percent since the year 2000. Belfast recorded thefts of 543 bikes in the 12 months up to June 2015. But in sheer terms of numbers, London is the UK hotspot for stolen steeds. The security team at the website www.bikeregister.com — the national cycle database used as the preferred bike marking system of a number of police forces — provided an exclusive list to us that puts London ahead of a top five that features Bristol, Edinburgh (as stated), Oxford and Cambridge.
It also lists the colour and types of bikes that are most likely to be stolen, while the Office For National Statistics data on the nature of cycle theft shows that year after year the majority of thefts (over 55%) occur in ‘semi-private’ areas. These include outside shops and at train station car parks, with bikes valued between £200 and £600 those most likely to be nicked.