How about a way to gauge your training, whatever your level of fitness and whatever your goal? Something that can rate your toil and sweat, so that you can get the right balance between challenging workouts, recovery sessions and rest?
Enter TRIMP, or Training Impulse. This is a fairly simple concept (as all the good ones are) that uses heart rate (HR) zones and a simple weighting system to calculate the amount of work done in a training session, a race, a week’s riding or a whole month’s worth.
This data has been used by Spanish sports scientists to calculate the TRIMP value of pro level races [1]. It was with this method that they concluded that the Tour and the Vuelta present a similar load on the cyclists despite being of different lengths.
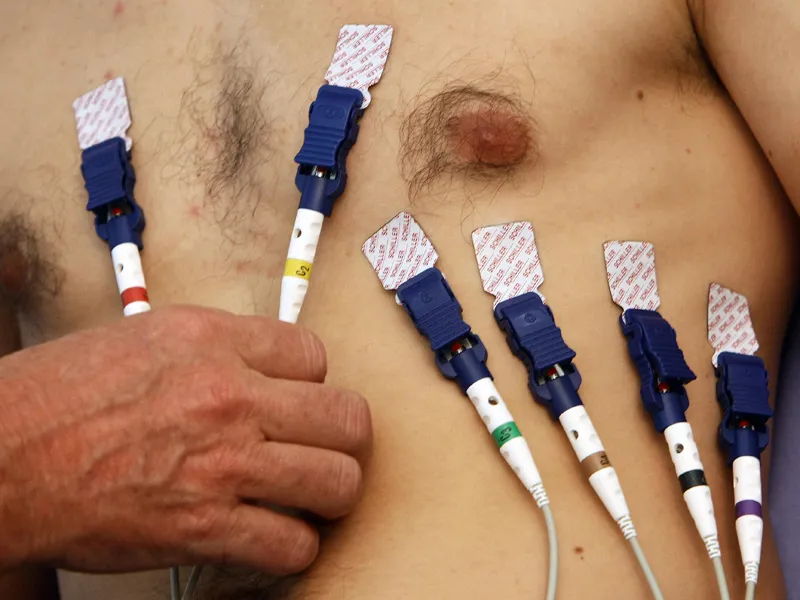
TRIMP HR zones [see definitions below] are calculated by having some physiological markers calculated as a rider performs a RAMP test in a laboratory. This specifically looks for a rider’s ventilatory threshold (defining the top of Zone 1 (Z1), bottom of Z2) and the respiratory compensation point (defining the top of Z2, bottom of Z3). Maximum HR defines the top of Z3. These two junctions at Z1/Z2 and Z2/Z3 are calculated using breath-bybreath analysis of a rider’s breathing – so not the sort of thing you can muster up at home.
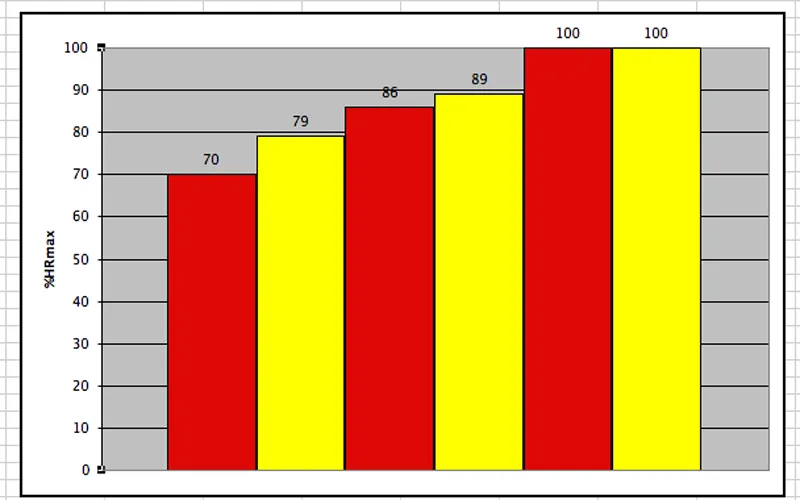
However, using HR data from the above riders (Lucia et al 2003) and a group of runners (Esteve-Lano et al 2005) [2] it is possible for you to approximate your HR where the zones start and stop. Take a look at the graph here which shows where the tops of each zone are.
Data comparing the HR zone spans of a group of riders (yellow columns) and runners (red columns) and how many TRIMP points to allocate each HR zone
As you can see they are fairly close although not exactly pinpoint perfect. Given the variations of rider fitness and assuming you do not get a lab test the zones can be approximated as:
Z1 HR resting to 75% HR max every minute is ONE TRIMP POINT
Z2 76% to 85% HR max every minute is TWO TRIMP POINTS
Z3 86% to 100% HR max every minute is THREE TRIMP POINTS.
So a rider with a HR max of 185 has zone junctions at 139 and 159. Thus using the weighting value of each minute in the respective zones a total TRIMP Value can be calculated. So a 3h ride in Z1 (180x1) gives 180 points but a 25-mile TT effort with 10mins in Z2 (10x2) and 52mins in Z3 (52x3) gives a TRIMP score of 20+156 = 176. Different ways to get a similar TRIMP value.
- TRIMP CALCULATION Consider a rider’s TRIMP points (pts) as he spends five days on the bike: MON Rollers recovery: 60min Z1 (60 TRIMP) TUE Chain Gang: 30min Z1, 15min Z2, 55min Z3 (225 TRIMP) WED Rest THR Interval session: 22min Z1, 20min Z2, 35min Z3 (167 TRIMP) FRI Rest SAT Club ‘10’: 25min Z1, 10min Z2, 28min Z3 (129 TRIMP) SUN Long club Ride: 160min Z1, 20min Z2 (200 TRIMP)
It can be seen that the Tuesday and Sunday sessions are actually harder than the race of the week. Granted it’s hard to go hard but the body also gets tired when you go long, or long and fairly hard. Monday, Wednesday and Friday give the required R&R, by Wednesday four days in a row will mean a day off is vital (accumulative four day score of 614 TRIMP).
Using TRIMP
The research so far – and I must stress that TRIMP, like other zoning formulas, is a theory and not a fact – backs up several concepts, eg. that base building is a key foundation to fitness and that high-end sessions are needed if you wish to compete but not more than about 20% of total volume.
Research on cross country skiers [2], backs up the runners’ data [2] referred to earlier that close to three quarters of your training should be less than three quarters effort (or somewhere under 70-80% of HRmax. Sorry it’s not an exact number but it equates to most of your training being mostly steady.
In fact in national level athletes the Z1 training volume was shown to be the most significant factor in determining performance in an event of around 35 minutes [2]. Yes, top end efforts were done but only 20 and 10% in Z2 and Z3 respectively.
So for a rider with 10 hours training this means 120mins in Z2 and 60mins in Z3 – at the very most. Conversely it means that 7 hours are spent below 75% HRmax – every minute above is increasing your Z2 score and not your Z1 score. So we don’t have universal exact percentages of where Z1 and Z2 exist but it is a novel way to calculate the training or fitness value of a session.
Not only that but pro cyclists’ racing efforts, elite runners’ competition build up and well trained XC skiers appear to support TRIMP as a valid system. Even those looking to lose weight can use this as a great way to get motivated by aiming to keep score of their TRIMP points – a lot more valid than just hours spent riding. It’s as easy as one, two, three…
REFERENCES
[1] Lucia, A.J. et al (2003) Tour de France versus Vuelta a Espana: which is
harder? Med. Sci. Sports Exerc. 35(5): 872-878.
[2] Esteve-Lanao, J. et al (2005) How do endurance runners actually train?
Relationship with competition performance. Med. Sci. Sports Exerc. 37(3):
496-504.
[3] Seiler, K.S. & Kjerland, G.Ø. (2005) Quantifying training intensity
distribution in elite endurance athletes: is there evidence for an optimal
distribution? Scand. J. Med. Sci. Sports. In press.