The BSXinsight claims to measure two things: lactate threshold via a multi-step test, and real-time muscle oxygenation with data that can stream to a smartphone or a Garmin Edge computer.
After months of testing, I have found that the device has fascinating potential, but the lactate-threshold measurement isn’t entirely reliable and the muscle-oxygenation data, while novel, isn’t immediately actionable for training.
Also, the BSXinsight is so far ahead of the game that things like muscle oxygenation aren’t yet integrated into standard training protocols as sports scientists and cycling coaches work out what do do with the data. Although oxygenation fields exist in Today's Plan training software and just added into a Garmin Edge software update in mid-March 2016, the BSXinsight is still closer to an experimental lab tool than a plug-and-play consumer product.
What is lactate threshold?
BSX uses two definitions: LT1 and LT2. BSX calls LT1 aerobic threshold, or the point at which exercise first produces a rise in blood lactate above a baseline.
It calls LT2 anaerobic threshold, which is closer to what most cyclists define as lactate threshold or functional threshold power. It is the point at which blood lactate rises steeply. Blood finger-prick tests will define this line as the point at which blood lactate rises by 1 mmol/L or more in two consecutive three-minute power-increase stages.
In practical terms, cycling coaches talk about FTP as the highest average power you can sustain for an hour.
Knowing your FTP number, either in heart rate or especially in power output in watts, is vital for targeted training. All your training zones are based around this number. So the concept of being able to accurately measure FTP at home is certainly of value. But can BSX deliver?
How BSX measures lactate threshold

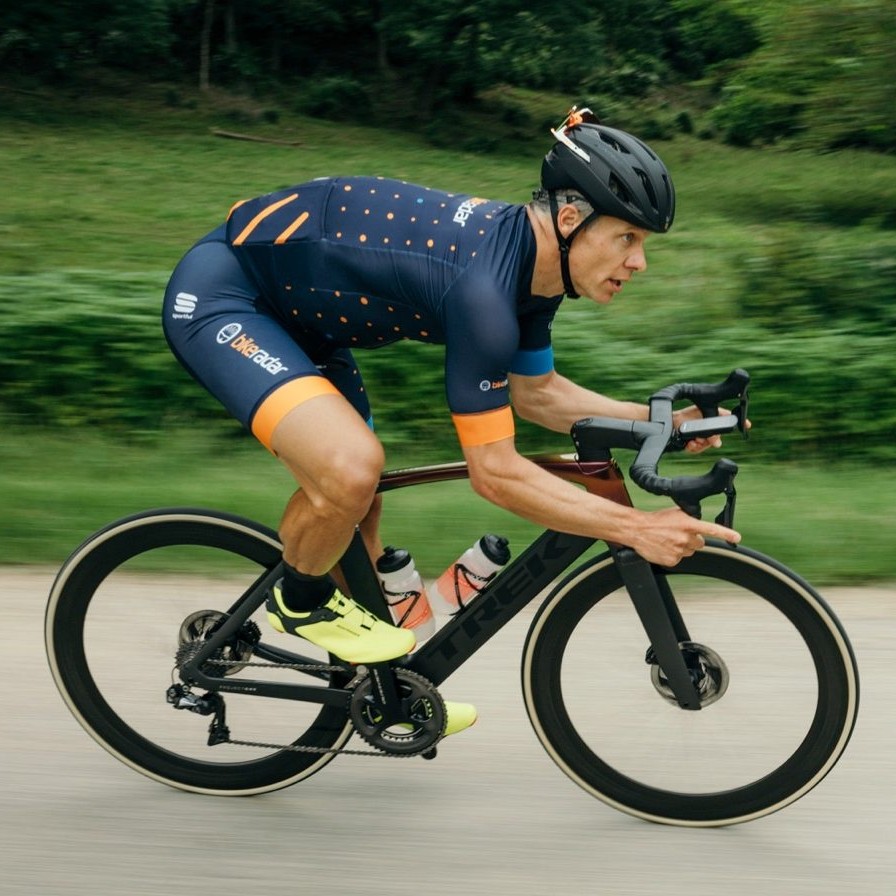
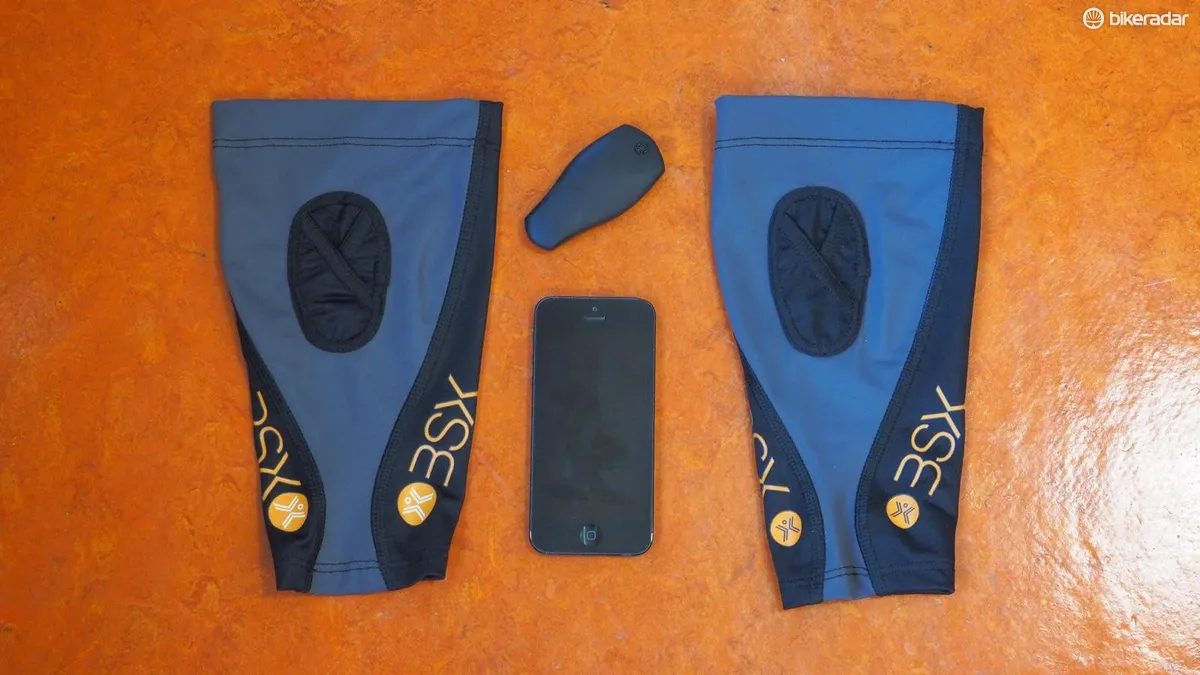
The BSX Insight consists of a little device the size of a wireless car key, a sleeve to hold it in place on the calf, and a smartphone app. To do the threshold test, you also need a trainer and a power meter, or a smart trainer with an integrated power meter.
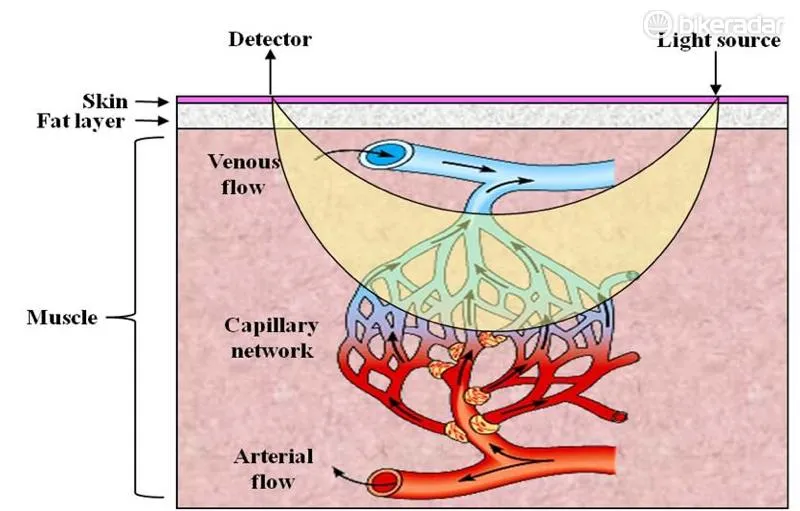
With the calf-mounted device, BSXinsight monitors muscle oxygenation via a light array shined into the muscle, measuring the light refraction.
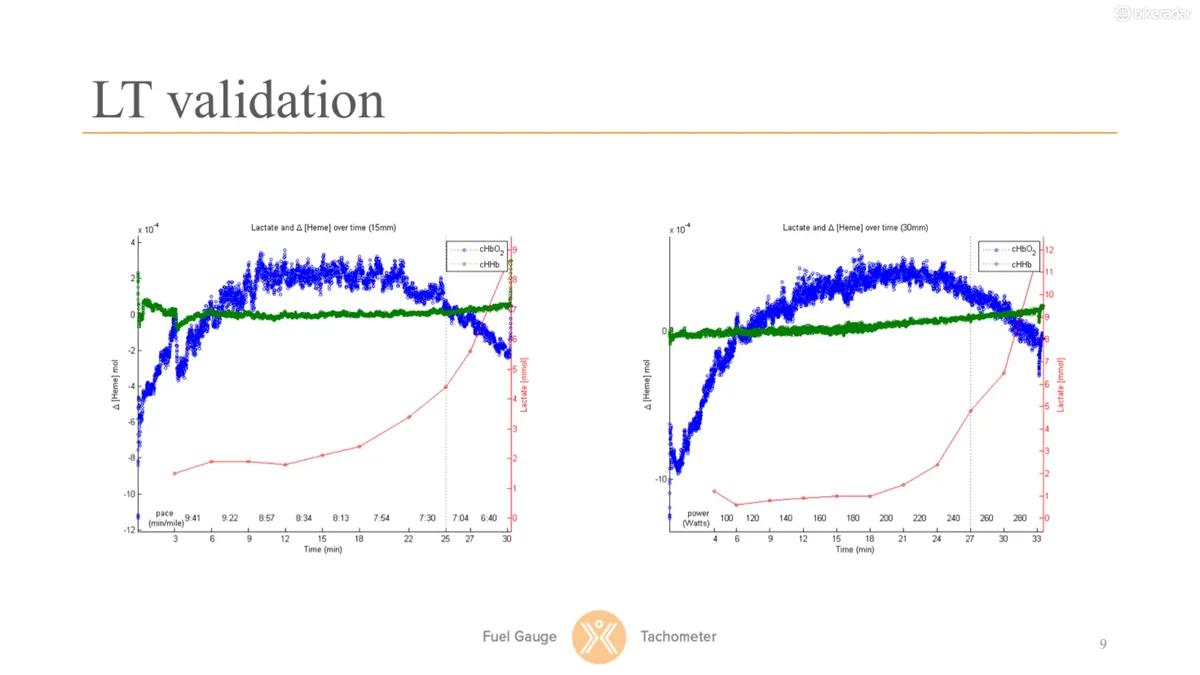
BSX claims that there is a close enough correlation between its measurements and blood lactate to pinpoint the lactate threshold.
My experience with BSX lactate threshold tests

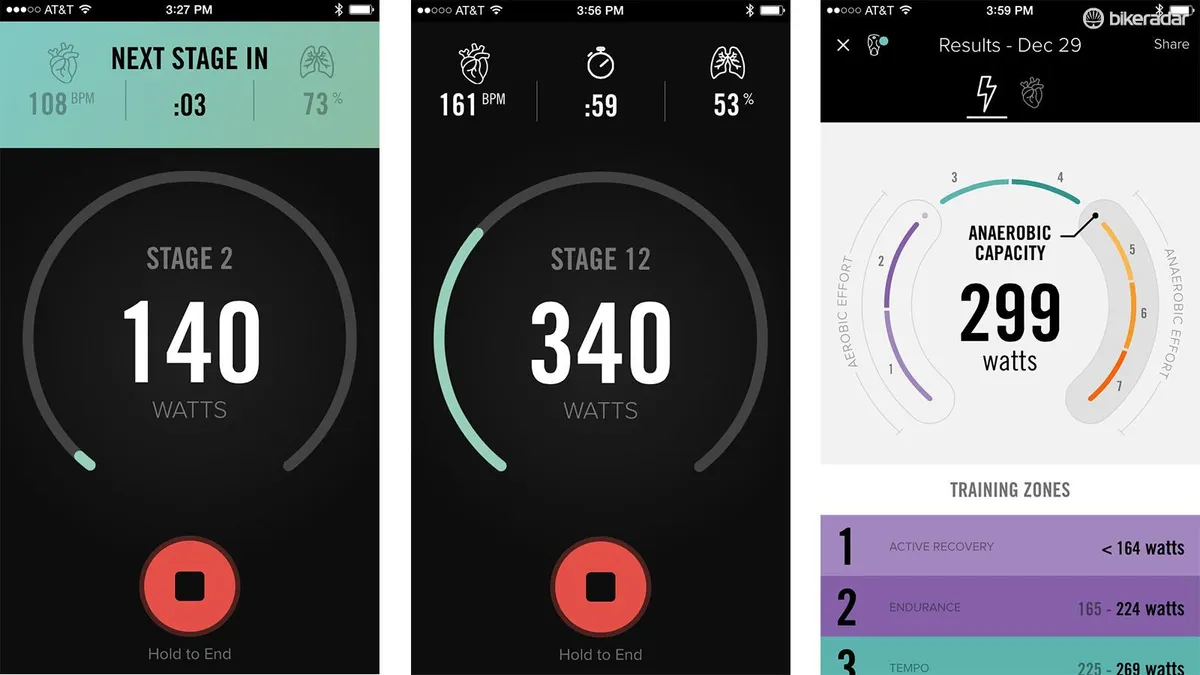
For the lactate threshold test, the app prompts 20w increases every three minutes, then gives you the results at the end
I’ve had a number of lab threshold tests over the years, and my number usually ranges between 285 and 320, depending on the time of year and how much I’ve been riding. I also keep a close eye on my numbers through TrainingPeaks, which — when used with a power meter – basically gives you your FTP as you can look at your best average power for specific durations on any specific ride or from the recent past. All that to say, I’ve got a pretty good idea of what numbers I should be seeing.
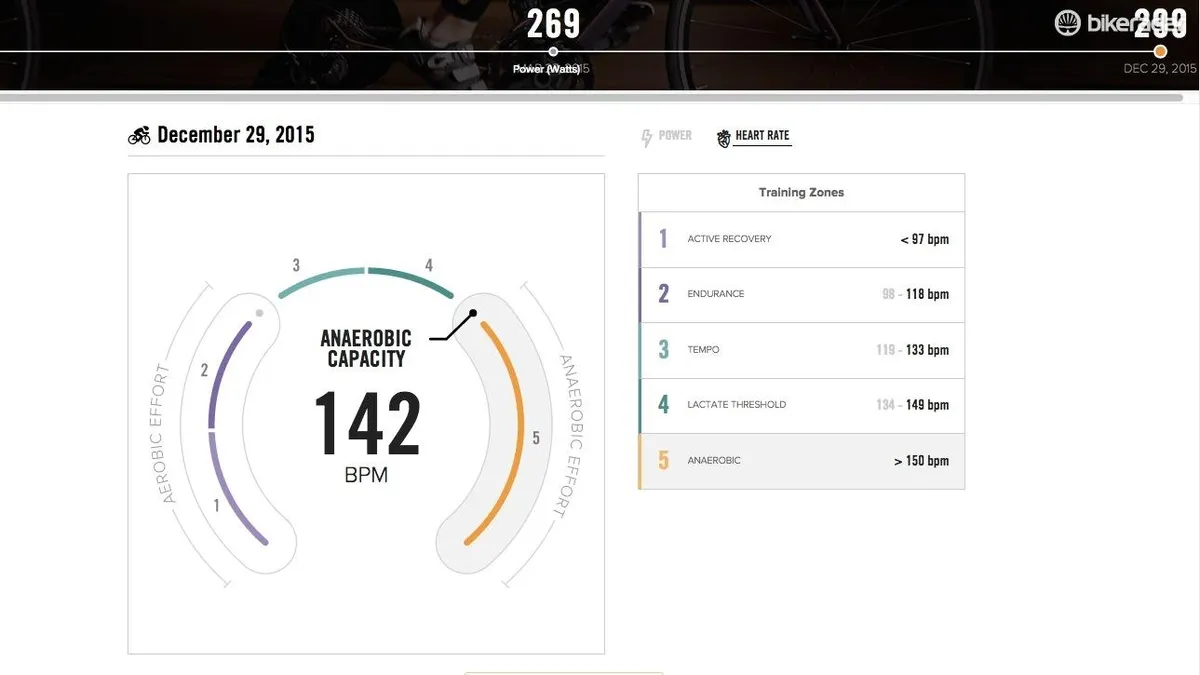
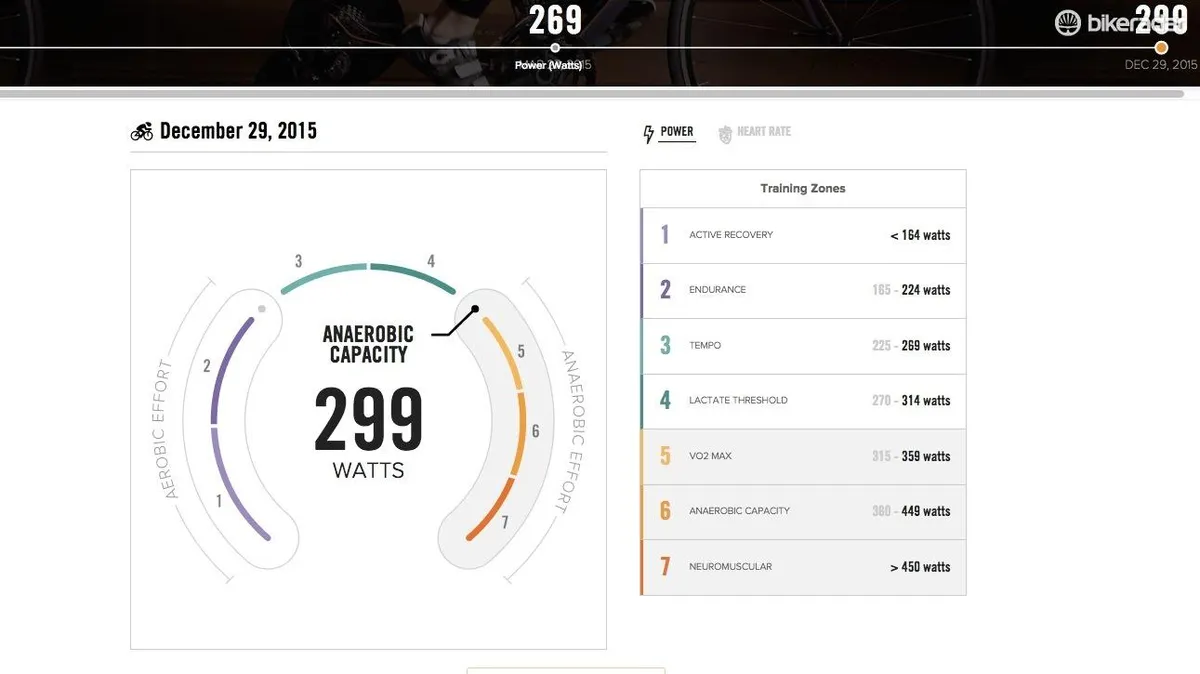
I did three threshold tests with the BSX. The first test told me my threshold was 269w, with a threshold heart rate of 120bpm. This is low on both metrics. The second test did not work, I was told at the end of the session by the app. This was a little frustrating as the test is fairly difficult to complete, as you ramp up 20w every three minutes until exhaustion. The third test told me my threshold was 299w, with a threshold heart rate of 142bpm. This seemed much closer, but still not reflective of the numbers I’ve seen in a lab and the numbers I get — particularly heart rate — when training on the road.

The LT test requires a power meter, a trainer and a smartphone. If you have a heart rate monitor, it will give you results in bpm, too
What is muscle oxygenation and how does BSXinsight measure it?
As you can perhaps work out, muscle oxygenation refers to the amount of oxygen in your working muscles. The harder you work, the less oxygen your muscles have. With the BSXinsight, this is measured at the calf with the same LED system.
My experience with muscle-oxygenation measurement
I did about a dozen training rides with the BSXinsight. There are two ways you can view the data in real-time, and both involve a smartphone at least for initial setup before each ride.
First, you need to pair the unit to a power meter and/or a heart rate monitor via an app. Then you can get the live data on your phone as you ride, which is what I did. You can also now get the data to pair to a Garmin, but I did my testing before Garmin added the SMO2 field.
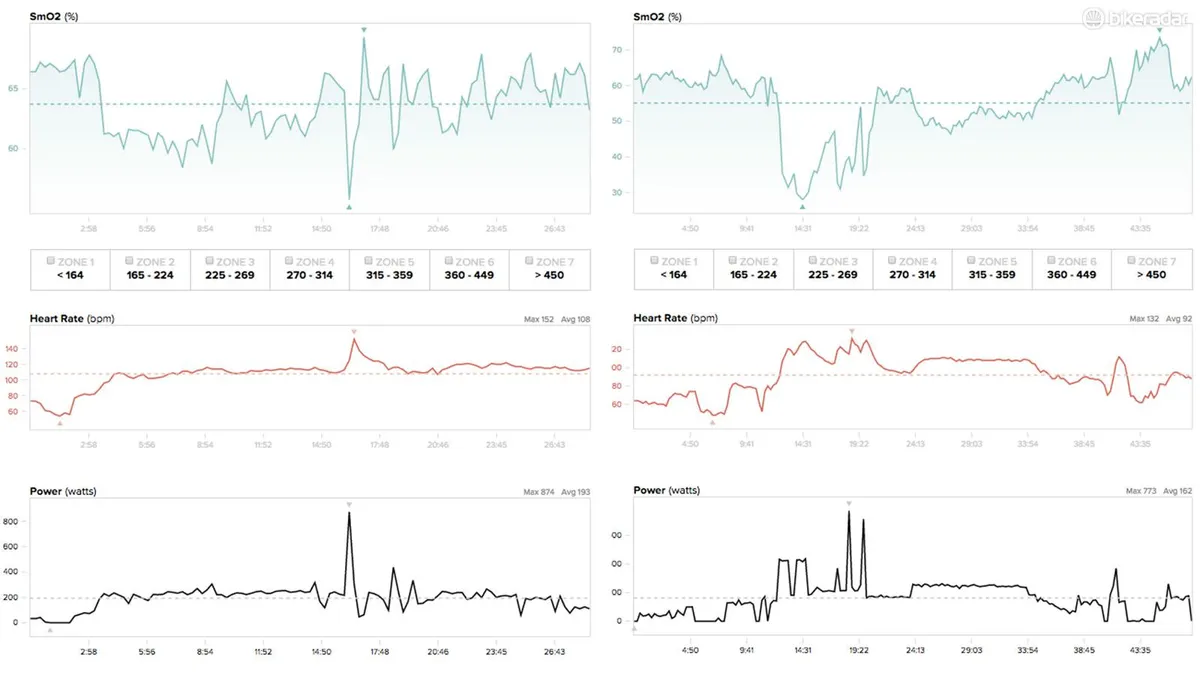
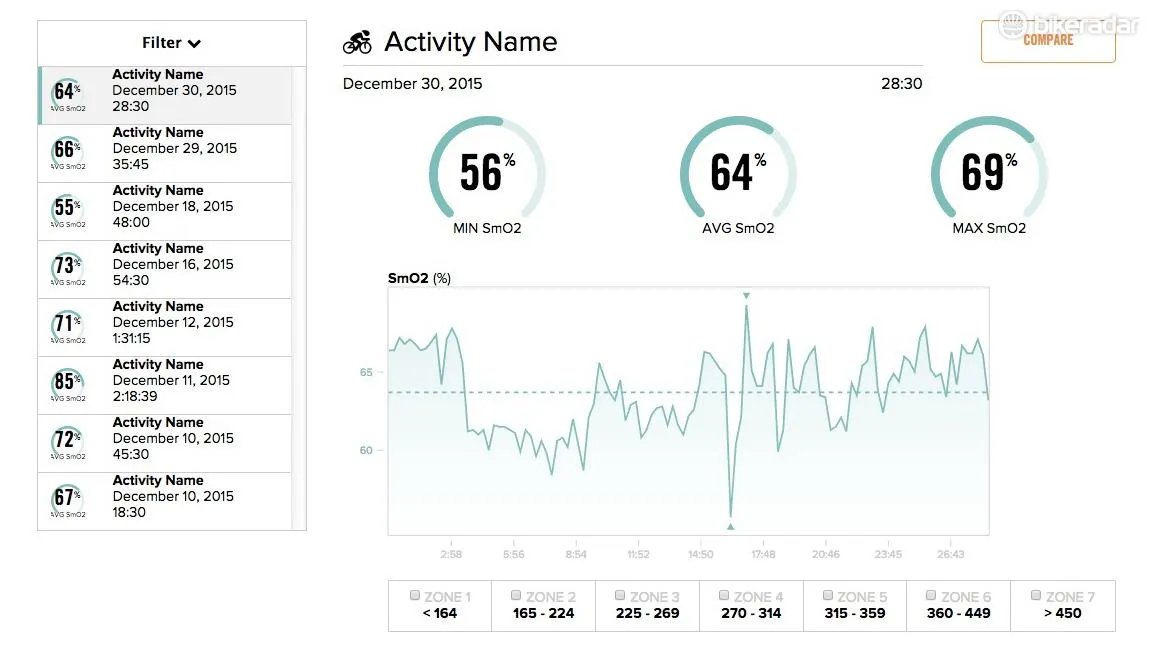
I noticed two main trends with the data. One, within a regular ride there wasn’t a huge variation in the number, shown as a percentage of total oxygenation. And two, I saw a big variation in the day-to-day numbers. For example, some rides would average 55%, while others would average 85%.

On normal rides, it is difficult to suss out any relevance for the SMO2 readings
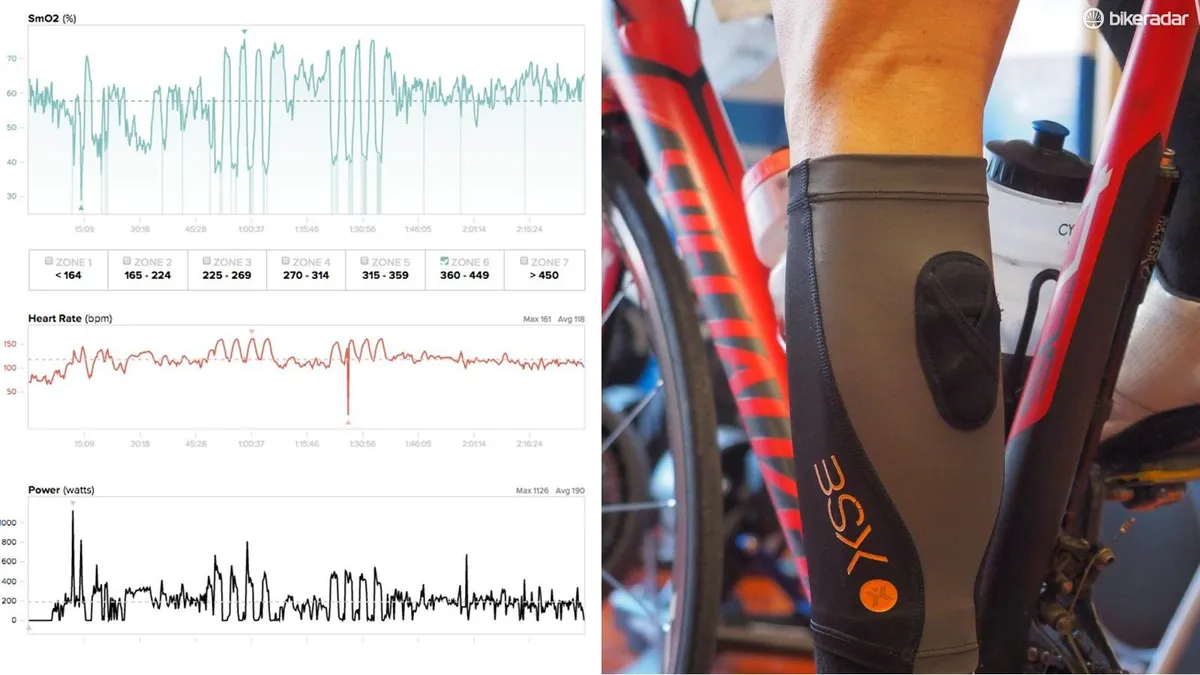
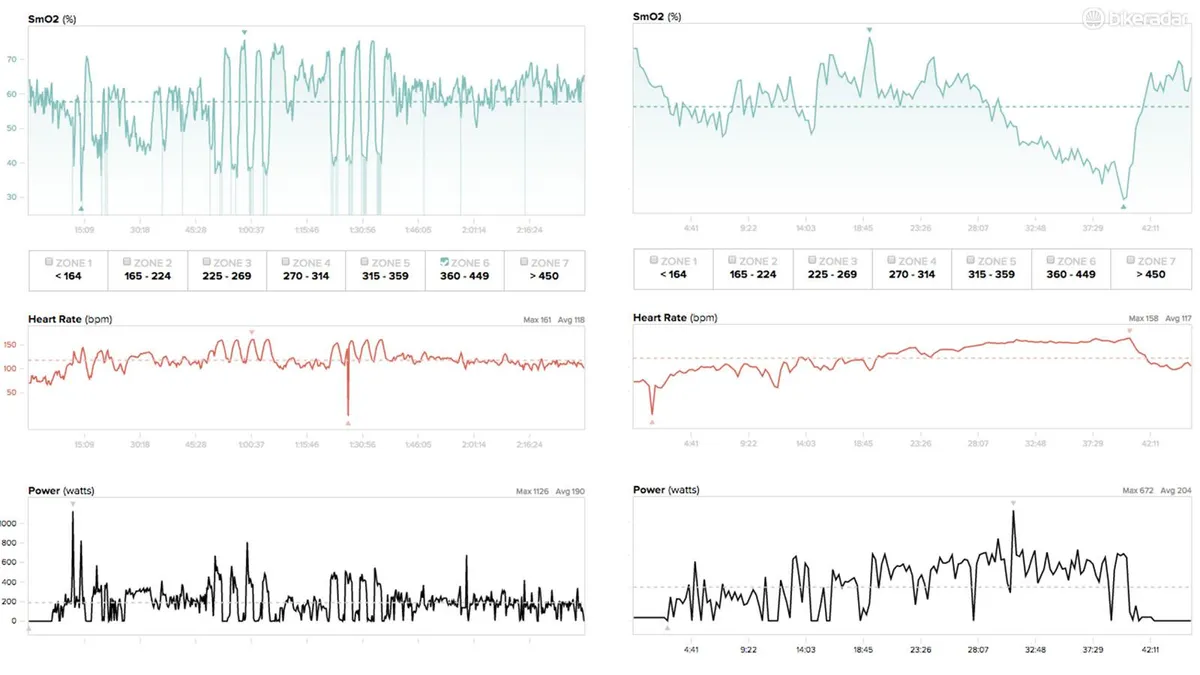
The most dramatic spikes and valleys can be seen while doing intervals. With 2-3min hard intervals, for example, you can see how power and heart rate go up and plateau, while muscle oxygenation plummets. At the end of the intervals, SMO2 rockets back up.
BSX’s Adam Alter says that riders could use SMO2 levels to gauge recovery from intervals. “You will truly know the impact on the muscle from one interval to the next by how low your SmO2 dropped,” Alter said. “You will better understand your condition, by how fast it recovers between intervals. You can test different rest points, rather than 1 minute rest, you rest until you hit, say 75% SmO2, for example.”
While there is indeed a direct correlation between hard interval effort and SMO2 drop, since I saw such a huge variation in day to day SMO2 numbers, I could not pinpoint any targets on the effort or recovery ends of the scale.
What seems to be needed at this point is extensive data tracking of power, heart rate and SMO2 over a longer term, with sports scientists weeding out trends — and perhaps providing suggestions of what to do with the data.

The SMO2 data comes alive when doing intervals, as shown at left. Further, the SMO2 data seems more informative of a hard effort's total effect on the body than heart rate, as the effort at right shows, where the heart rate stays steady while SMO2 continues to plummet
Not yet a fluid consumer product
As illustrated above, BSXinsight is clunky to set up, as you have to do each of these steps before each ride: Pull unit from charger (but not too soon before you engage as it will fall back to sleep and you’ll have to put it back in the charger), put it in the sleeve, pull on the sleeve, open the app, get the app to find the unit, get the app to connect to your power meter and then heart rate. Then, and only then, you can press start and get on with it. There are bugs on the analysis end, too; in order to see my ride data on the website I have to log out, clear my cache and log back in.
Beyond all that, the thing just looks goofy. Riding in the cold of Colorado’s winter, it hasn’t been an issue to hide under tights or leg warmers. But come spring, I don’t know if I’m bold enough to wear a big calf sleeve without a good answer for why I’m wearing it.

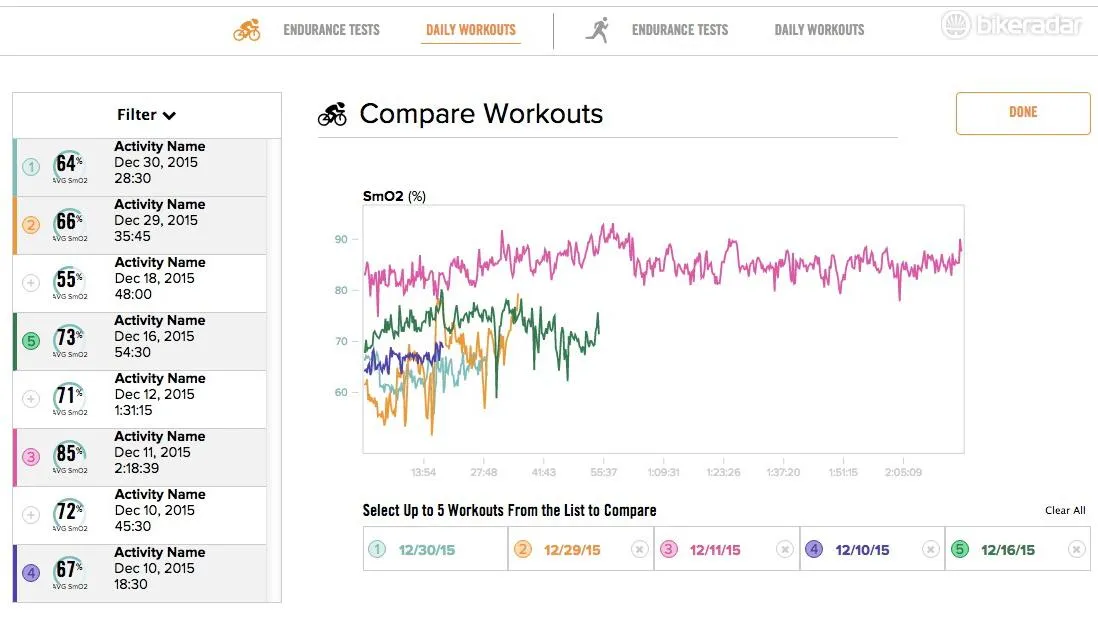
The starting and average SMO2 readings varied wildly from day to day
Bottom line
Is knowing your lactate threshold valuable for training? Absolutely. Do you need a BSXinsight to get a usable functional threshold power number? Absolutely not. There are many good ways to determine your number through a field test (ride as hard as you can for 20min, multiple the average by .95) or with software like TrainerRoad or Zwift.
The muscle oxygenation measurement is novel and intriguing. There is a definite correlation between going hard and oxygenation levels dropping, and the BSXinsight seems to do a good job of capturing this data. The question is, what the heck do you do with it?
In my experience, while the peaks and valleys were well defined while doing intervals, the overall average numbers and the just-riding-along numbers varied by a huge amount day to day. Whereas 250 watts will always be 250 watts (and to a lesser, fuzzier extent, a heart rate of 155bpm will often indicate a similar amount of effort), an SMO2 rating of 65% seemed to have no specific correlation to an intensity level. Sometimes the decreasing SMO2 rating would hold more information on a long effort than heart rate. For instance, going all out towards the end of a climb, heart rate would stay roughly the same, while SMO2 continued to plummet as I dug myself deeper and deeper into a hole. See the graph at right, two images up for an example of this. In this situation, the SMO2 number seems more representative of the effort — of the effect of the effort — than heart rate. But even then, what do you do with this information?
At the end of the day, we will need to leave this to elite-level coaches and physiologists to work out the use, and then let BSX work on how to integrate the device more smoothly into the rest of our gadget ecosystem. In the meantime, if you already have a heart rate monitor and a power meter and are looking for a way to invest in smarter training, I would recommend you hire a coach who can give you practical, actionable steps towards achieving goals using power. Personally, I’ll look forward to seeing where BSX goes in the coming years.

Would you wear something like this on your calf?